Acoustic Systems

When exploring little-known regions of the ocean, the first thing needed is an accurate map of the seafloor terrain. Whether on land, in the sea, or on another planet, a good map provides the fundamental basis for further exploration. With the vast majority of the world’s deep oceans unmapped by modern technology, we often need to create our own maps to make new discoveries and plan efficient and safe operations.
Sonar (short for “sound navigation and ranging”) is a tool that uses sound waves to explore the underwater realm. Sound travels much farther in water than light does, making it a more effective means of remotely exploring and mapping the great depths of the ocean. Nautilus is equipped with a variety of sonars that help us characterize seafloor terrain, oceanographic currents, and even the geologic structure underneath the seabed.
Mapping the World’s Seafloor with a Multibeam Echosounder
Multibeam sonar is used to map the seafloor and detect objects in the water column or along the seafloor. The multiple physical sensors of the sonar – called a transducer array – send and receive sound pulses that map the seafloor or detect other objects.
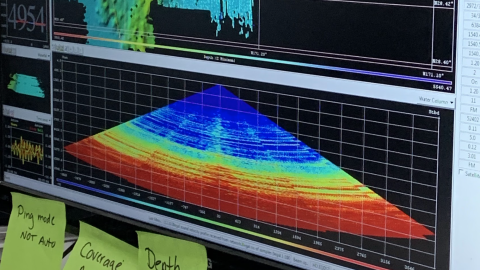
One transducer (the transmit array) emits acoustic pulses that ensonify the seafloor with a wide fan-shaped swath of sound, while a second transducer listens for their return echoes. Each pulse sends many beams of sound in a fan shape toward the seafloor (thus the name “multibeam”). When these pulses strike the seafloor and return to the sonar receiver mounted on the hull of the ship, the system computes a “sounding” associated with each returning pulse via the time it took to travel down and up through the water column. The ship is moving between when the multibeam transmits and receives signals, so a motion sensor connected to the system allows it to “steer” the sound pulses to compensate for the ship’s rolling and swaying, and to collect an even distribution of data on the seafloor. Received soundings are combined with the ship’s Global Navigation Satellite System (GNSS) information to produce a grid or “digital elevation model” of ocean bathymetry -- essentially a topographic map of the seafloor. In shallow water, the sonar can make a more detailed map of the terrain, but the area covered is smaller. In deep water, the area mapped with a single pass of the ship is much larger, but the resolution of the resulting map is lower.
When you look at global maps of the ocean in programs like Google Earth, it may look like we know all there is to know about the shape of the seafloor. It certainly looks like it, but this is because we are looking from far away, and these impressive-looking maps are built primarily using data collected by satellite altimetry measurements of the sea surface and have very few modern depth observations and only the general highs and lows of deep-sea topography.
[image]
In addition to mapping the shape of the seafloor terrain (“bathymetry”) under the ship, the strength of the returning echo that the sonar receives back from the seafloor (“backscatter”) is measured across the sonar swath. The strength of the backscatter echo is affected by many variables, but when properly processed these data can indicate variations in the seafloor type. Reflections from a rocky seafloor will generally provide a stronger signal than a muddy area. These backscatter measurements are combined in another grid called a backscatter mosaic, and this can be combined with the bathymetry grid to provide a better understanding of both the shape and relative hardness of the seafloor.
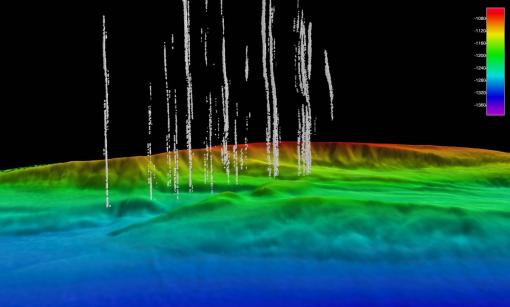
Our multibeam echosounder can also detect phenomena in the water column, such as plumes of bubbles emanating from the seafloor that indicate gas seeps. From 2015 to 2021, OET documented thousands of methane seeps along the Cascadia Margin off the Oregon and Washington coast.
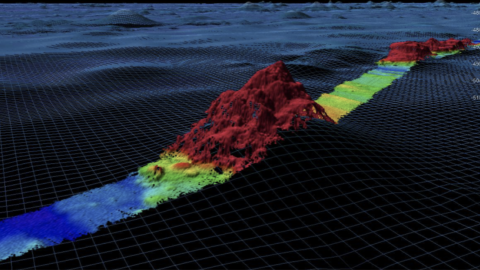
Whether focused on a canyon, seamount, or shipwreck, creating a map allows us to identify potential targets for more detailed explorations, cutting down exploration time and boosting our mission efficiency. Before ROVs are deployed, our team must first map the area to understand the characteristics of the region and identify potential features of top exploration priority and plan out the ROV dive.

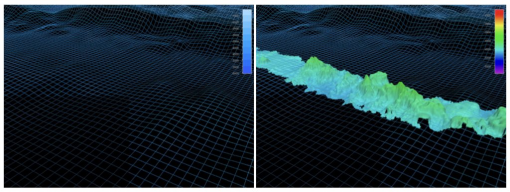
Comparison of seafloor terrain features resolved by maps derived from satellite altimetry data (top image), and the same area after being mapped with a modern deep water multibeam sonar system (bottom image).
In addition to informing dive objectives, Nautilus transit routes cover unmapped areas of the ocean and contribute to the Seabed 2030 initiative, an international collaborative project to combine all bathymetric data in order to create a comprehensive map of the ocean floor. Since 2012, we have mapped over 1.3 million square kilometers (460,000 square miles) of the seafloor in the Atlantic, Gulf of Mexico, Caribbean Sea, and Pacific Ocean. Seafloor mapping began more than a century ago, yet less than 28 percent of the world’s ocean has been charted at high resolutions. In fact, we have better maps of Mars than of the seafloor!
Kongsberg EM304 MKII Multibeam Sonar
Nautilus is equipped with a hull-mounted Kongsberg EM304 MKII multibeam sonar that simultaneously collects bathymetric, seafloor backscatter, and water column backscatter data to enable the identification of features of interest and the production of high-quality seafloor maps at depths up to 11,000 meters (36,089 feet). Scientists onboard the ship may reference “mowing the lawn” and “pinging the seafloor,” which means our multibeam is hard at work surveying an area with overlapping sonar swaths to build a high resolution map of the terrain. The EM304 replaced our previous-generation EM302 sonar that mapped over 1.3 million square kilometers over thirteen years of service on Nautilus. The EM304 was installed in April 2026, and provides a wider swath width that substantially increases the area of seafloor the ship can map and explore, especially in very deep waters typical of the majority of remote ocean areas that Nautilus expeditions explore.
Exploring Sub-surface Geology with the Knudsen Sub-bottom Profiler and Echosounder
Revealing structures below the seabed provides marine geologists with key information to interpret the shallow sub-surface geology of the seafloor. Complementing our multibeam mapping work, our team utilizes a Knudsen 3260 sub-bottom profiler and echosounder to reveal geological layering patterns beneath the seafloor. Mounted inside the hull of Nautilus, the echosounder operates at low frequencies to penetrate and reflect off the layers of sediment, revealing a cross-section of the seafloor structure.
The dual-frequency profiler operates at 3.5Khz or 15Khz (two discrete channels with separate transducers) and is capable of full ocean depth soundings. An acoustic pulse is directed through the water column to the seafloor and then captured by the system as it bounces back from each layer. Scientists can use the data to identify subsurface geological structures such as faults, ancient channels, and buried levees.
Kongsberg EC150 Acoustic Doppler Current Profiler (ADCP)
In early 2023, OET installed a Kongsberg Simrad EC150-3C 150 kilohertz Transducer on E/V Nautilus. This new sonar is mounted on the ship's hull, and the EC150-3C is the first of its kind to combine an acoustic Doppler current profiler (ADCP) and an EK80 split-beam fisheries sonar into one instrument. The ADCP, which measures the speed and direction of currents at various depths underneath the ship, supports safe deployments and recoveries of remotely-operated vehicles (ROVs), autonomous underwater vehicles (AUVs), and other oceanographic vehicles. The integrated split-beam echosounder is used to map and characterize features found within the water column, such as biology, scattering layers, and potentially bubble plumes. These capabilities enable E/V Nautilus to better serve as an operations hub for multi-vehicle operations, increase OET’s capacity to explore and map the water column, and to collaborate with partners from the Ocean Exploration Cooperative Institute to advance combined robotics and new technologies to increase and advance the pace of ocean exploration.
Underwater Navigation: Keeping Track of ROVs Atalanta and Hercules
It is important that we know where ROVs Hercules and Atalanta are during each dive so they can find targets selected in the dive plan, and also to make sure we know the location of any discovery or sample taken on the seabed. We also want to keep them safe and away from any dangerous areas on the seafloor. Nautilus utilizes the Global Navigation Satellite System (GNSS) and the Fugro satellite correction service to calculate the position of Nautilus in the world within a few centimeters accuracy. However, the GNSS doesn't work underwater, and an ultra-short baseline (USBL) navigation system helps us track Atalanta and Hercules when the duo is diving at extreme depths. The USBL sonar is lowered down the ship’s moonpool tube for each ROV dive in order to track the subsea vehicles’ positions. Each of the ROVs is outfitted with a transponder beacon to enable acoustic signals between the ship and each vehicle. The USBL sends an acoustic pulse through the water, or an electrical pulse down the cable, to Hercules and Atalanta. When the ROV transponder receives the signal from the ship, it responds with an acoustic pulse of its own. It’s as if the ship is asking the ROVs, “Where are you?” and receiving an “Over here!” response, similar to an underwater Marco Polo game. Once the USBL system receives the pulse, the position of each ROV relative to the ship is computed based on the travel time of the pulse and the direction from which it is received, and it is then combined with the ship's position to calculate the location of the ROVs in the water column and along the seabed.
Science & Tech
Ocean exploration is a dynamic balance of understanding science and using the best in underwater technology.
Expeditions
Get a sneak peek of where we're headed next or revisit the discoveries of our past expeditions.
Classroom Resources
OET hosts a suite of free educational materials for use in classrooms, at home, or in the community.
Acoustic Systems At-a-Glance
Kongsberg EM304 MKII Multibeam Sonar
The EM 304 is a hull-mounted 20-32 kilohertz multibeam echosounder composed of two long transducer arrays mounted in a T-shape on the hull of E/V Nautilus. The EM 304 can map the seafloor in water depths from 20 up to 11,000 meters (feet) at ship speeds up to 12 knots.
- Frequency 30 kHz
- Depth Range 20–7,000 meters (65–36,089 feet)
- Pulse Forms CW and FM chirp
- Angular resolution 1° × 1°
- Approximate swath width up to 5.5 times water depth, up to 12 km (7.5 miles)
- Soundings per swath Up to 1600 in dual mode
- Approximate grid resolution 1-5% water depth (e.g., 10-15 meters [33-164 feet] at 1,000 meters [3,281 feet] depth)
Knudsen 3260 Sub-bottom Profiler and Echosounder
The Knudsen 3260 is a sub-bottom echosounder mounted inside the hull of E/V Nautilus. It operates at low frequencies (3.5 and 15 kilohertz) so that emitted sound can penetrate layers of sediment to about 80 meters below the seabed surface.
- Profiler Knudsen 3260 Chirp sub-bottom profiler and echosounder
- Operating Frequency Dual frequency, 3.5 kHz and 15 kHz
- Power 4 kW on Channel 1 and up to 2 kW on Channel 2
- Range 50 meters to full ocean depth
Kongsberg Simrad EC150-3C Transducer
The Kongsberg Simrad EC150-3C 150 kilohertz is a hull-mounted transducer on E/V Nautilus that combines an acoustic Doppler current profiler (ADCP) and an EK80 split-beam fisheries sonar into one instrument. The ADCP measures the speed and direction of currents underneath the ship, whereas the split-beam echosounder maps features found within the water column.
- Frequency 150 kilohertz (130-170 kilohertz range)
- Max Depth Range About 130 meters (426 feet)
- Beamwidth 3° at 150 kilohertz
- Pulse Forms CW or FM
- ADCP Number of Beams 4
- ADCP Depth Bin Cell Size customizable between 2-16 meters (6.5-52.5 feet)
Ultra-Short Baseline Navigation System
The ultra-short baseline (USBL) navigation system tracks the ROVs' positions in the water. The system consists of a hull-mounted transceiver on E/V Nautilus. Each ROV is outfitted with a transponder beacon, enabling acoustic signals between the ship and each vehicle to determine their positions.
- System Sonardyne Ranger 2 with Lodestar GyroUSBL transceiver deployed from the moonpool for USBL tracking of ROVs Hercules, Little Hercules, or Atalanta
- Range Up to 7,000 meters (22,966 feet)
- Positioning Accuracy 0.5% of slant range
- Operational COVERAGE +/- 90°
- Operating Frequency 19 to 34 kHz
- Targets Tracked Hercules, Little Hercules, Atalanta, and three additional transponders are available. Partner vehicles can be tracked with the addition of compatible Sonardyne transponders.