Mapping to the Speed of Sound: How UCTD Instruments Inform Acoustic Mapping

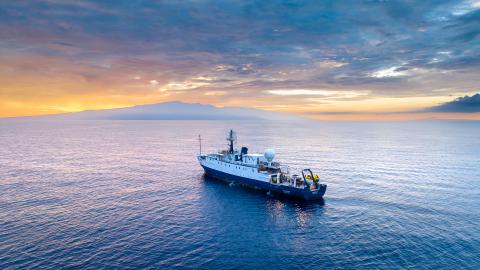
What echolocation is to cetaceans, acoustic systems are to E/V Nautilus. Just like whales and dolphins “see” by sound, mapping experts use acoustics to produce bathymetric maps of the seafloor to inform exploratory operations. As you might use a road map to navigate safely, our Corps of Exploration uses high-resolution maps of dive sites as guidance to ensure that remotely operated vehicles (ROVs) operate safely and efficiently.
Just as the properties of different road types influence how quickly one might drive a car — slower on dirt roads and faster on highways, for example — so too are our acoustic systems influenced by the properties of seawater. This is why our team of mapping experts uses oceanographic instruments to measure water properties that could either slow down or accelerate the movement of our sonar signals through the water column. The Underway Conductivity Temperature and Depth (UCTD) is one such instrument. It measures salinity, temperature, and pressure in the ocean and captures variations as we move from the ocean surface to the seafloor.
We’ll dive deeper into what goes into a UTCD analysis. But first, let’s take a look at how we make maps.
Mapping With Sound
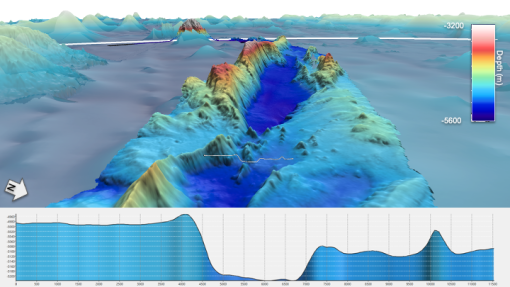
To produce seafloor maps, Nautilus is equipped with a hull-mounted Kongsberg EM302 multibeam echosounder sonar system with the capability to map and provide information about the texture of the seafloor (also known as the backscatter). The multibeam echosounder has two transducers, one emitting sound and another receiving it.
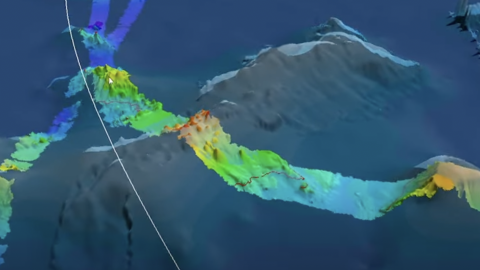
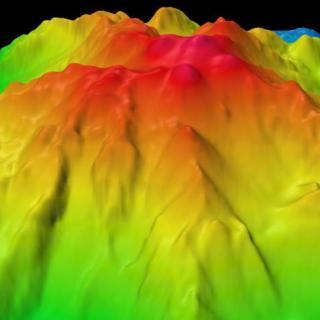
When mapping the seafloor, one transducer sends a fan-shaped swath of acoustic signals to the seafloor, and the other transducer “listens” to pick up the echoing sound after it bounces off the bottom and travels back toward the surface. The sonar system can calculate the time it takes for each acoustic signal to travel to the bottom and return to the ship, generating a series of what’s known as sounding values. As we repeat this process and cover the extent of the unmapped seafloor, this sounding information is combined with data from the ship’s Global Navigation Satellite System (GNSS) to produce a colorful topographic representation of the shapes and depth of the seafloor.
Ocean Properties That Influence the Speed of Sound
If you have ever walked on the beach, you might have noticed dry sand requires a different amount of effort than walking on more compacted, wet sand that waves have impacted. As your feet require a different amount of effort moving over these surfaces, the speed and distance of sound will vary as it moves through water — and that depends on the water density. Density is determined by how closely together molecules are to one another.
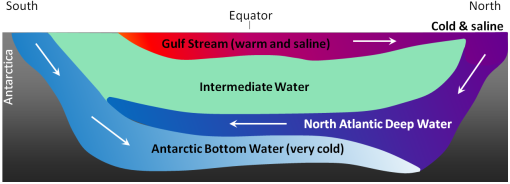
When we peer into the ocean, it may appear that water is uniform. With special tools, however, we have determined that there are layers within the water column, each with a unique set of properties, including density. Generally speaking, sound travels faster through denser water, though this can also be influenced by temperature, salinity, and pressure. Because these variables are dynamic and change within the water column, the relationship between the speed of sound and water depth can be complicated.
Since the accuracy of our maps is closely connected to the time it takes for sound to descend the water column and ascend to the surface our mapping experts corroborate on-ship data against measurements of salinity, pressure, and temperature. One way they can do this is by deploying a UCTD instrument.
Calculating the Speed of Sound Via a UCTD Cast
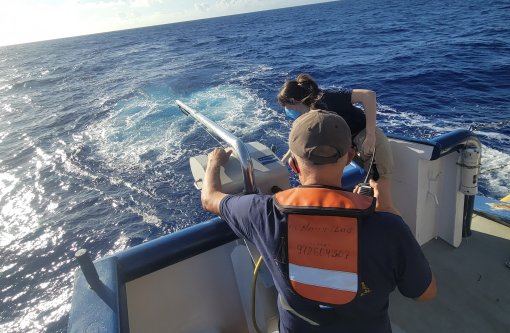
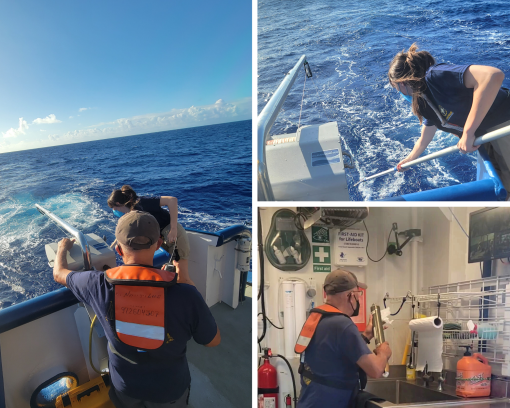
Researchers deploy the UCTD instrument periodically throughout mapping cruises like NA140, Johnston Atoll Mapping. Science Communication Fellow Yashira A. Cruz Rodriguez joined hydrographers and mapping experts Lindsay Gee and Hayley Drennon on the aft deck for a first-hand look. Let’s explore.
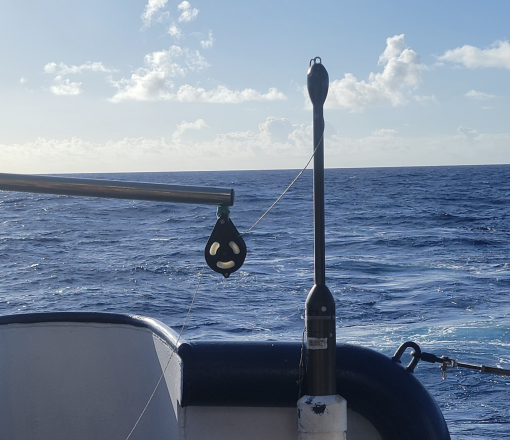
On the ship, the UCTD instrument sits on a metal base on the aft deck, awaiting deployment. A cable capable of descending to depths of over 500 meters connects the instrument to a winch on the ship, which connects to a motor that releases and retracts the cable during deployment and recovery. The instrument’s aerodynamic profile and a combination of lead weights allow it to descend vertically into the water.
As its name suggests, the UCTD instrument contains a series of sensors that collect information about water temperature, conductivity (as an indication of salinity), and pressure (as an indication of depth). This data is stored on a removable USB flash drive.
As the probe descends into the water column, it collects information until it reaches its maximum depth between 400 and 500 meters. Once here, its motor is activated, and the connecting cable reels back to the ship to ascend the instrument. At the surface, the probe is slowly reeled in along the ship’s wake until the mapping team recovers it with a specially designed pole.
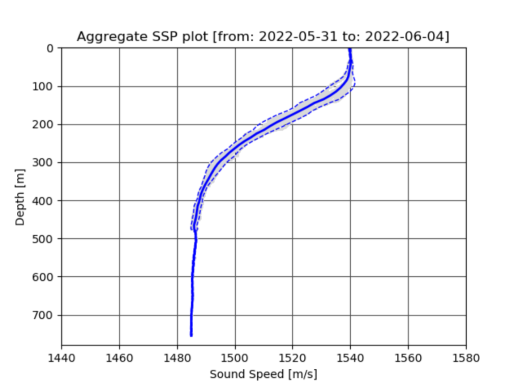
Onboard, the probe is washed with freshwater to keep the metallic components from rusting. The USB flash drive is removed and connected to a computer where collected data is converted to what’s known as a “sound speed profile.” The whole process takes about 30 minutes.
Sound speed profiles are representations of the speed of sound in relation to the depth of the water. It's akin to capturing a snapshot of a vertical slice of the ocean at a given moment. The mapping team onboard processes this speed profile data to ensure consistency. Sound speed values are inputted into the Seafloor Information System (SIS) — a computer program that reflects all the information gathered while mapping the seafloor — to calibrate the multibeam sonar.
Researchers repeat this process two to three times each day while seafloor mapping as a way of tracking potential daily changes in the water column.
Measuring Ocean Properties Goes Beyond Seafloor Mapping
Marine scientists keep historical records of water temperature and salinity profiles because this data is beneficial for understanding oceanic, climatological, and environmental patterns. It may also help identify significant changes over time. Information from UCTD profiles and other critical oceanographic variables is kept in a global database coordinated through the National Oceanographic and Atmospheric Administration's (NOAA) World Ocean Database.
Learn more about the acoustic mapping technology aboard Nautilus by exploring these Ocean Exploration Trust education resources:
- Blog: Read the Rainbow: Seafloor Mapping Glossary
- Blog: More than just bathymetry
- Blog: What’s in a name? Defining Cartography and Hydrography
- STEAM Educational Module: Seafloor mapping simulation (available in English and Spanish)
- Mini-lesson: Painting Rainbows on the Seafloor
About the Author
Yashira A. Cruz Rodriguez is an environmental and marine science educator as well as an instructional designer. In her work, she combines educational theory and research, design principles, and technology to develop meaningful STEAM-focused learning experiences. Find her latest work on Instagram @marinescopes.
Johnston Atoll Mapping
This 24-day expedition will involve multibeam and sub-bottom profiler mapping to reveal the seafloor within the Johnston Atoll Unit of Pacific Remote Island Marine National Monument (PRIMNM). Johnston Atoll, one of the most isolated atolls globally, is located in the central Pacific Ocean, between the Hawaiian Islands and the Line Islands. The main objective of this expedition will be to collect high-resolution seafloor bathymetry data where it has not been previously collected.