Read the Rainbow: Seafloor Mapping Glossary

When the Nautilus team is seafloor mapping, the screens of Nautilus Live are awash in colors as our sonar systems reveal high resolution imagery of seafloor landscapes. Learn to read the rainbow with this seafloor mapping glossary of common terms you'll hear used by our mappers, navigators and science team!
Compiled with Seafloor Mapping Intern Kelsey Barnhill & Mapping Coordinator Lindsay Gee.
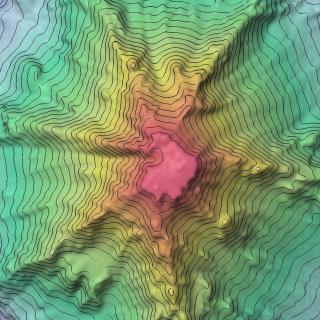
Seamount image above processed with QPS Maritime Solutions software.
Multibeam Sonar Terms
Mounted on the hull of Nautilus, the multibeam sonar transducer emits two powerful pulses of sound (or “pings”) that travel to the seafloor. As the pulses bounce off the seafloor and travel back up to the receiving array, the distance to the seafloor can be determined from the travel time and the speed of sound through water. Unlike early mapping systems that emitted a single beam of sound to the seafloor and only returned one sounding (e.g. one depth measurement per ping), the multibeam sonar emits two fans of beams, resulting in a wider "swath width" with up to 864 soundings per ping! Learn more about using multibeam sonar as a tool for exploration.
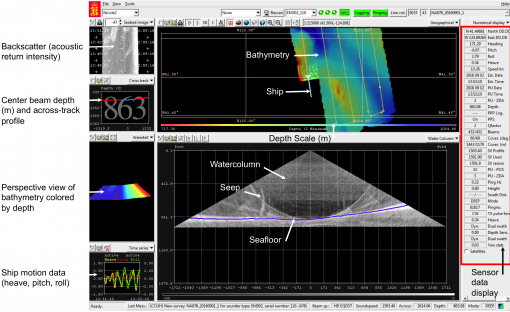
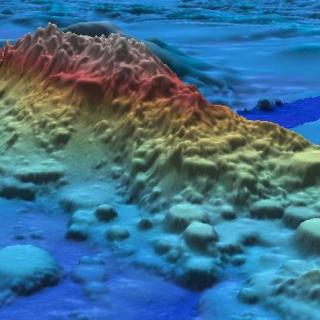
Bathymetry- Bathymetry is the topography of the sea floor. Mapping tools are used to determine the shape of the seafloor. Undersea mountains, canyons, basins, or flat plains are examples of seafloor features that are the bathymetric features of the area.
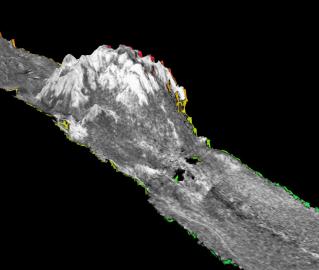
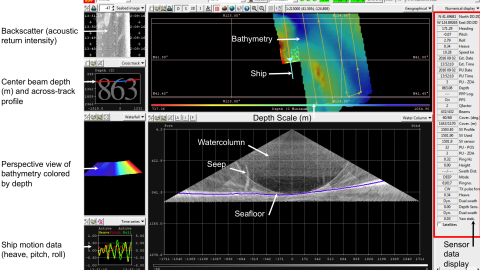
Backscatter- (acoustic return intensity) Backscatter is what we use to determine the type of material or sediment on the seafloor. Backscatter is displayed in gray scale to show intensity and the lighter the return normally indicates a harder seafloor. A light area could be a rocky area, whereas darker shades indicate soft sediment like silt or mud.
Center beam and across-track profile- The depth immediately below the hull of the ship, where the center point of the multibeam is located. The profile shows the 432 soundings taken per “ping” across the beam of the vessel.
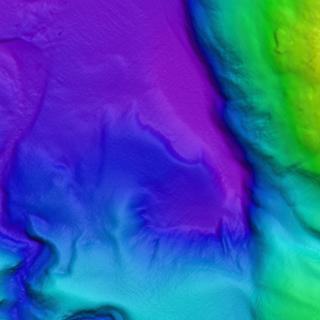
Perspective view of bathymetry colored by depth- The main screen shows a bird’s eye view of our mapping progress. The rainbow of colors correlate with relative depth. A red area means it is the shallowest area we are mapping in the area and a purple color means it is the deepest.
Ship motion data- In the bottom left of the screen you can see a tri-color graph. This graph is tracking the ship’s motion, including heave (up and down motion), pitch (front and back alternate up and down motion), and roll (side-to-side motion). The multibeam uses this information to compensate for the ship’s movement when receiving measurements from the seafloor.
Sensor data display- This sidebar includes data streams from supporting sensors, including position, sound velocity, depth, and more for monitoring performance of the mapping system.
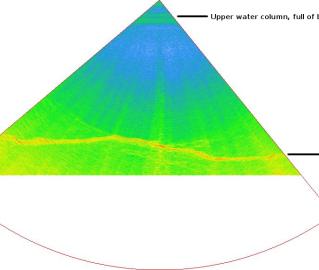
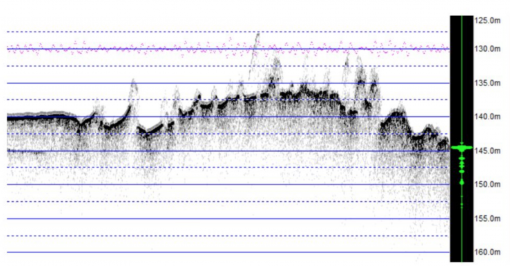
Water column mapping- Whenever the multibeam is collecting data about the seafloor, it is also collecting data about what is in the water column. This is of particular interest to us when we are looking for methane seeps. After the bathymetry data is processed we examine the water column data to see if we can find any vertical signatures that could be a seep. The purple or red horizontal line marks the seafloor, while vertical plumes may indicate possible seafloor seeps.
Sub-bottom Sonar Terms
The sub-bottom sonar system mounted on the hull of E/V Nautilus provides data on the geological structure and sediment types below the surface of the seafloor. Data from this system is used to identify geological features like paleoshorelines or hydrothermal vent systems.
Pulse and Power- Both the pulse and the power are increased with increased depth. When we are mapping in deeper waters we need to increase both in order to send a stronger signal and give the chirp more energy to reach the seafloor.
Range- The range is set depending on depth and how often the bathymetry is changing. In shallow waters, the range can be 50 meters while it can be 200 meters in a deeper area with steep drop-offs.
Phase- Current Depth being viewed. Software typically displays a 200-meter range so an example of a phase would be 300-500 meters.
Chirp- We often refer to the subbottom signal as sending down a “chirp” or a “ping” to the seafloor.
Mapping Technology Terms
UCTD- This is another instrument to measure the sound velocity of the water column to adjust the multibeam sonar. The Underway CTD collects conductivity, temperature, and depth information while the ship is underway and moving at speeds of 8-10 knots. This information helps our mapping team adjust the sonar instruments to suit current seawater conditions and ensure more accurate mapping data is collected.
XBT- Often when we are mapping we go out on the back deck to launch an XBT, an expendable bathythermograph. An XBT is launched when we move into an area where the physical oceanography of the water is different from the previous area. These are done approximately every 4 hours. An XBT is used to measure the sound-speed profile of the water by collecting depth and temperature information, and later adding in salinity information as well. This is sent to the multibeam to adjust for changes in the spped as sound from the surface to the seafloor.
Sound speed profile: A sound speed profile shows the speed of sound moving through water at different layers in the ocean. Sound speed is affected by temperature, depth, and salinity of the water. We launch XBTs and UCTDs to determine sound speed in seawater.
Hypack- Hypack is the navigation software we use to plan our lines and plan out the course of a survey. This is the same software that the bridge uses to direct ship movement.
Fledermaus- This is a QPS Maritime Solutions suite of software that we use to analyze the backscatter intensity and the water column data of the sites that we are studying.
Qimera- This is a QPS Maritime Solutions software we use to process the bathymetry from the multibeam sonar. We compile all the lines during a survey and clean up the data and remove any outliers which may be in the data due to bad weather or returns from the water column.
California Mapping
This expedition will continue previous years of mapping by Nautilus to provide the foundational seafloor mapping data set of a number of priority sites of Greater Farallones National Marine Sanctuary (GFNMS) and Cordell Bank National Marine Sanctuary (CBNMS). GFNMS protects 3,295 square miles, and the CBNMS encompasses 1,286 square miles of seafloor habitat, and achieving a better understanding of habitats in these regions helps to inform conservation and management.
Pacific Seamounts
This mapping expedition will focus on unmapped areas of the Pacific between San Francisco and Honolulu as E/V Nautilus operations move out into the Pacific Ocean between the Hawaiian Islands and Samoa. The transit route will utilize the multibeam echosounder and sub-bottom profiler to fill in gaps in seabed mapping coverage across the Pacific, plus targeted mapping of a number of seamounts in the vicinity of the Murray Fracture zone.
Pacific Seamounts
The expedition will focus on mapping from Honolulu to San Francisco, as the E/V Nautilus’ operations move back east to the US West Coast, in addition to the first deep water test of a new mobile ROV system. The mapping route has been planned to utilize the multibeam echosounder and sub-bottom profiler to fill in gaps in seabed mapping coverage across the Pacific.